About Dr. Kim Roth
Welcome! I am Kim, a statistician at
MATH AND CRAFTS WORKSHOP PARTICIPANTS!
Graph picture and Mathfest Data
I have training in both statistics and mathematics. Currently my research is in statistical techniques for microbial genomics, but my original field is complex dynamics. My interests also include the Scholarship of Teaching and Learning in statistics, data science, and mathematics and recreational mathematics. I joined the statistics department at Penn State in Fall 2025 as a Teaching Professor after many years at Juniata College.
My Ph.D is in mathematics from The Pennsylvania State University and my Masters in Applied Statistics is from the Pennsylvania State University’s World Campus. My bachelor’s degree is in mathematics with a minor in computer science from Oberlin College.
Data Art
Currently I am making data art based on historical weather heat maps.Two of the heat maps are currently on display at the data art show at the Joint Statistical Meetings in Boston. Bianca Thompson and I will be doing a felt heatmap bild at Mathfest in Boston on Friday August 7th in the workshop Math and Crafts: Fun for All!
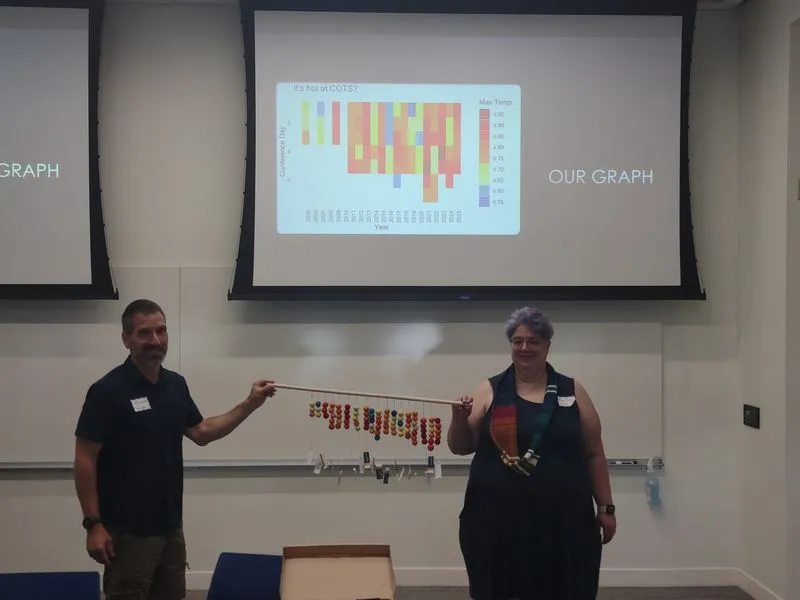
Most recently I gave the plenary "Make Data Art" and a related workshop at the Slow Data: Central Pennsylvania eCOTS 2026 Regional Meeting at Bucknell University in June 2026. Here are the slides. As part of the workshop we build the following heat map.
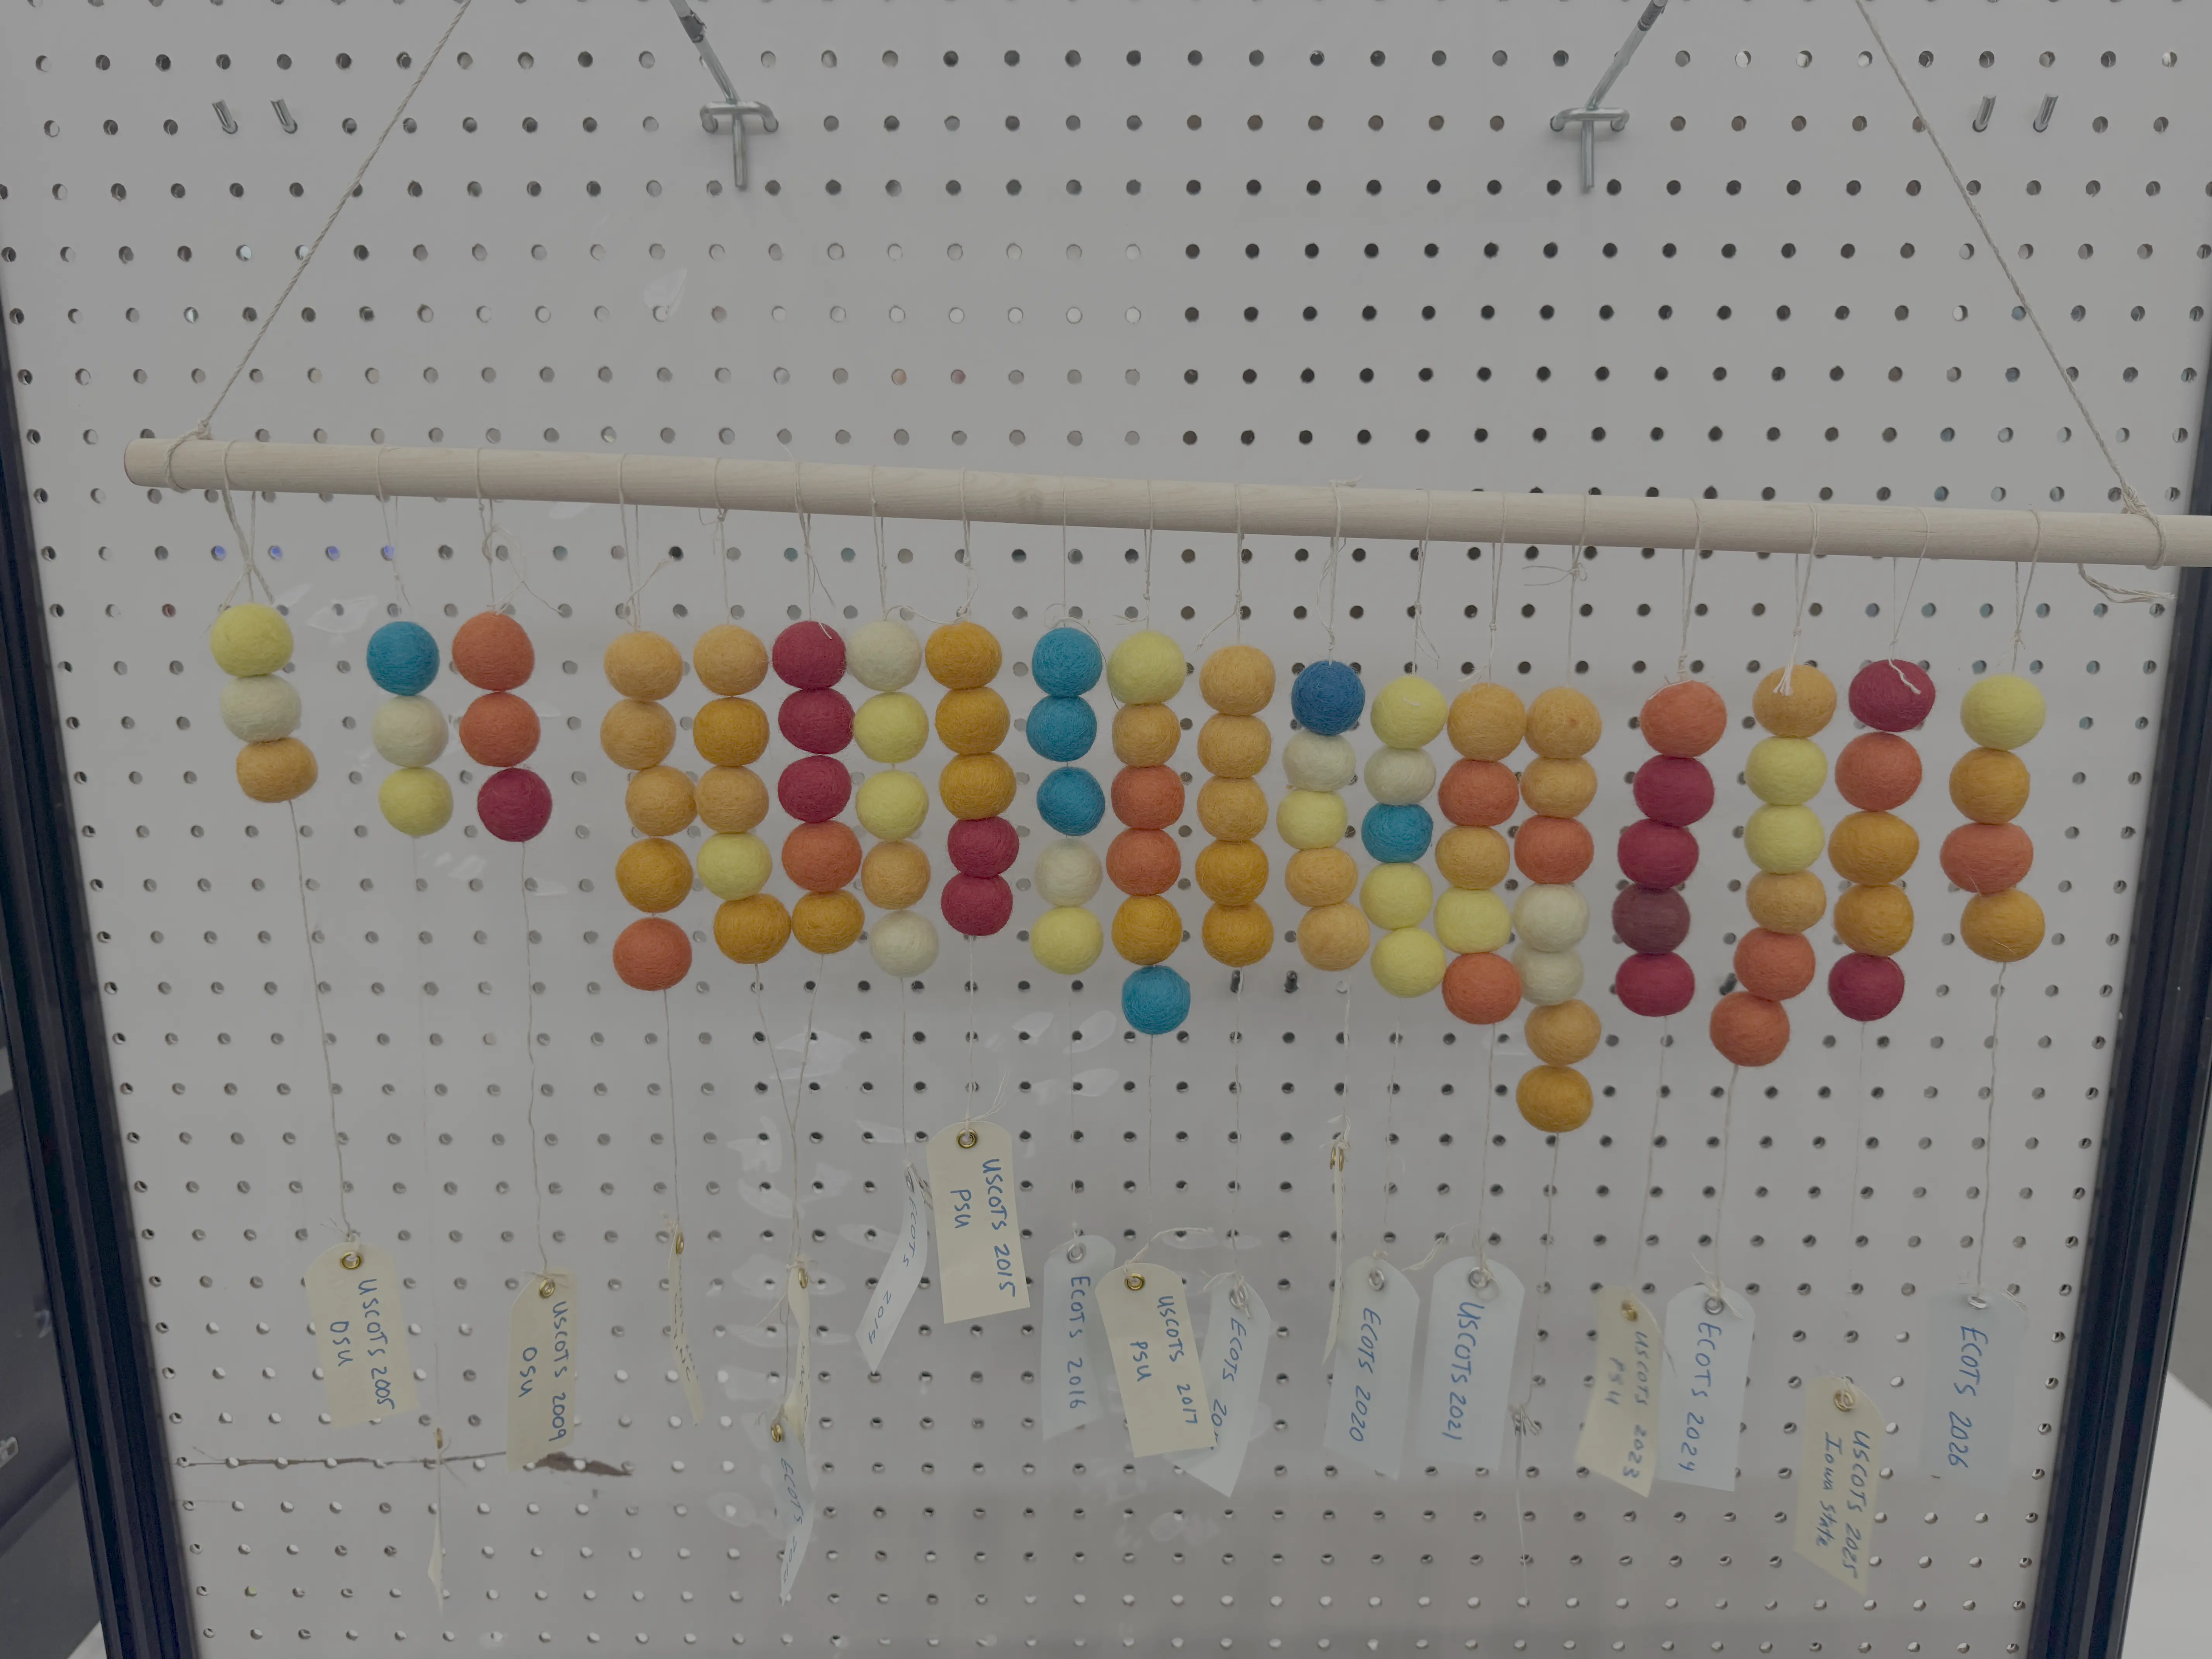
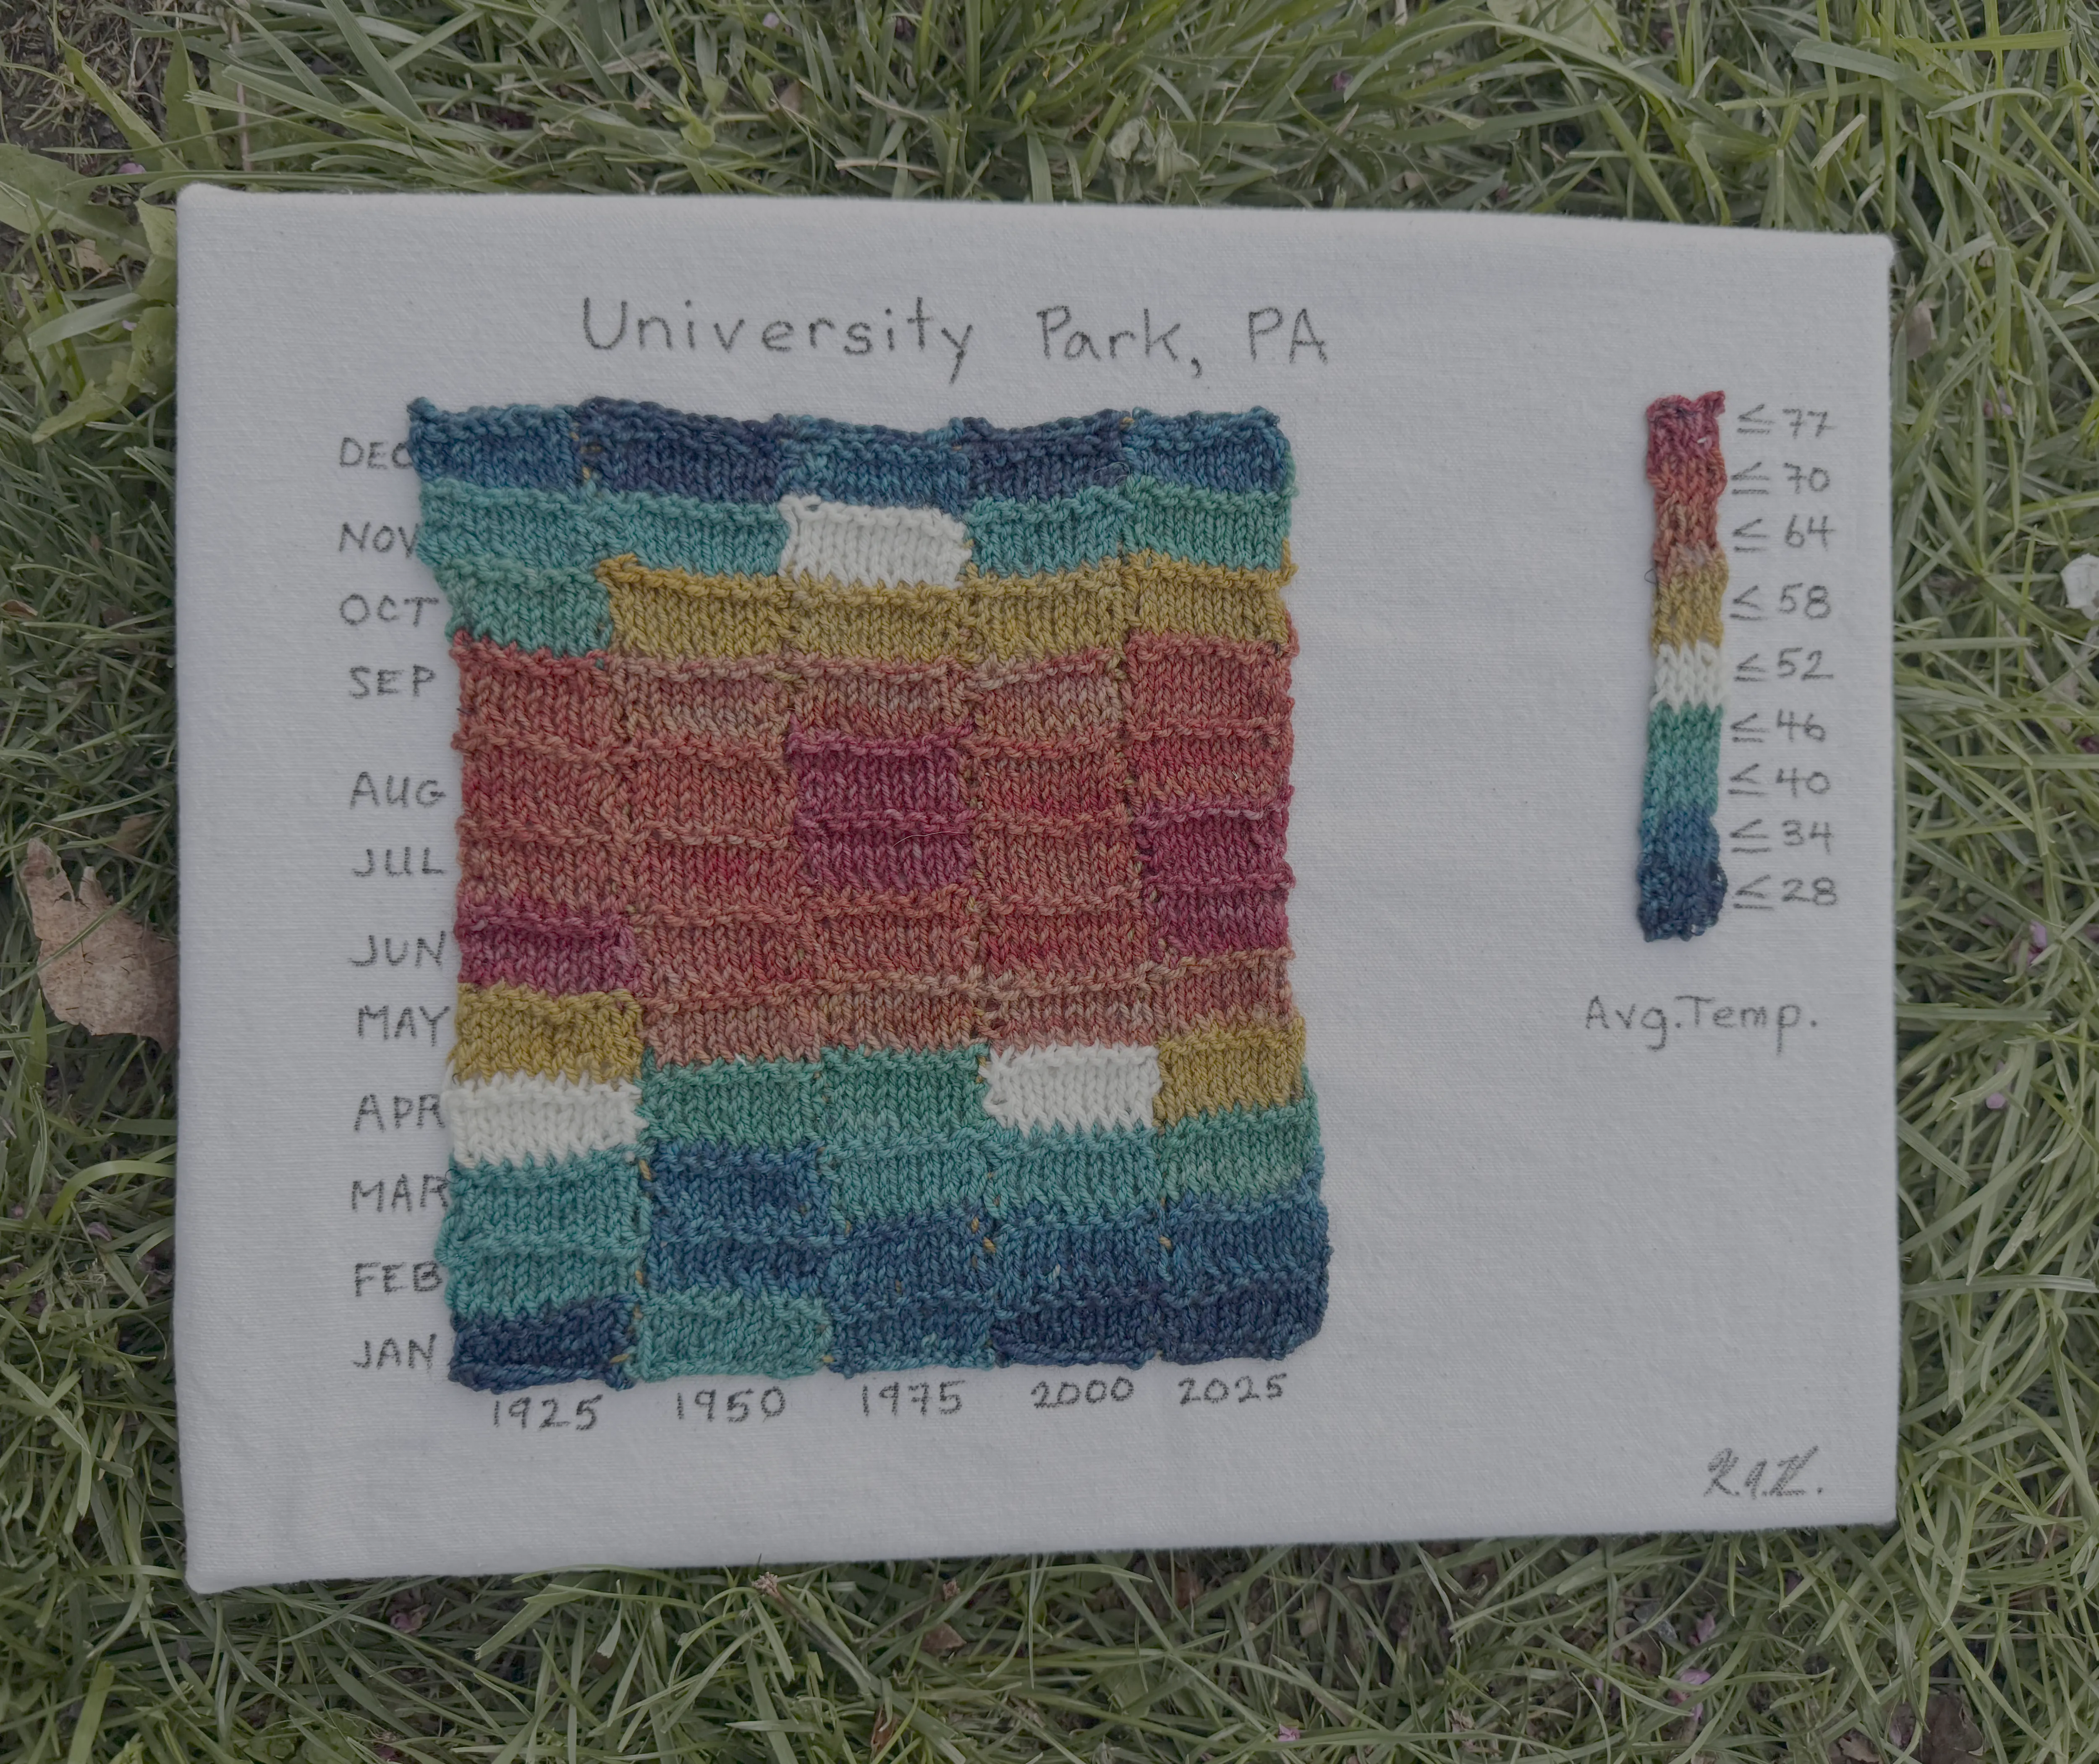
I showed my first heat map at the Make or Bake your Science event for the Eberly College of Science at Penn State and the Office of Equity, Diversity and Inclusion of the Eberly College of Science asked for a piece of art. I made a 100 years of Penn State temperture piece and discovered in the process that it is much more difficult to get weather data prior to 1940 and nearly impossible before around 1880.
The series begin with a 25 minute invited talk, "Data Driven Art: Local Historical Weather Patterns" at Illustrating Mathematics Reunion/Expansion at ICERM. Here are the slides.
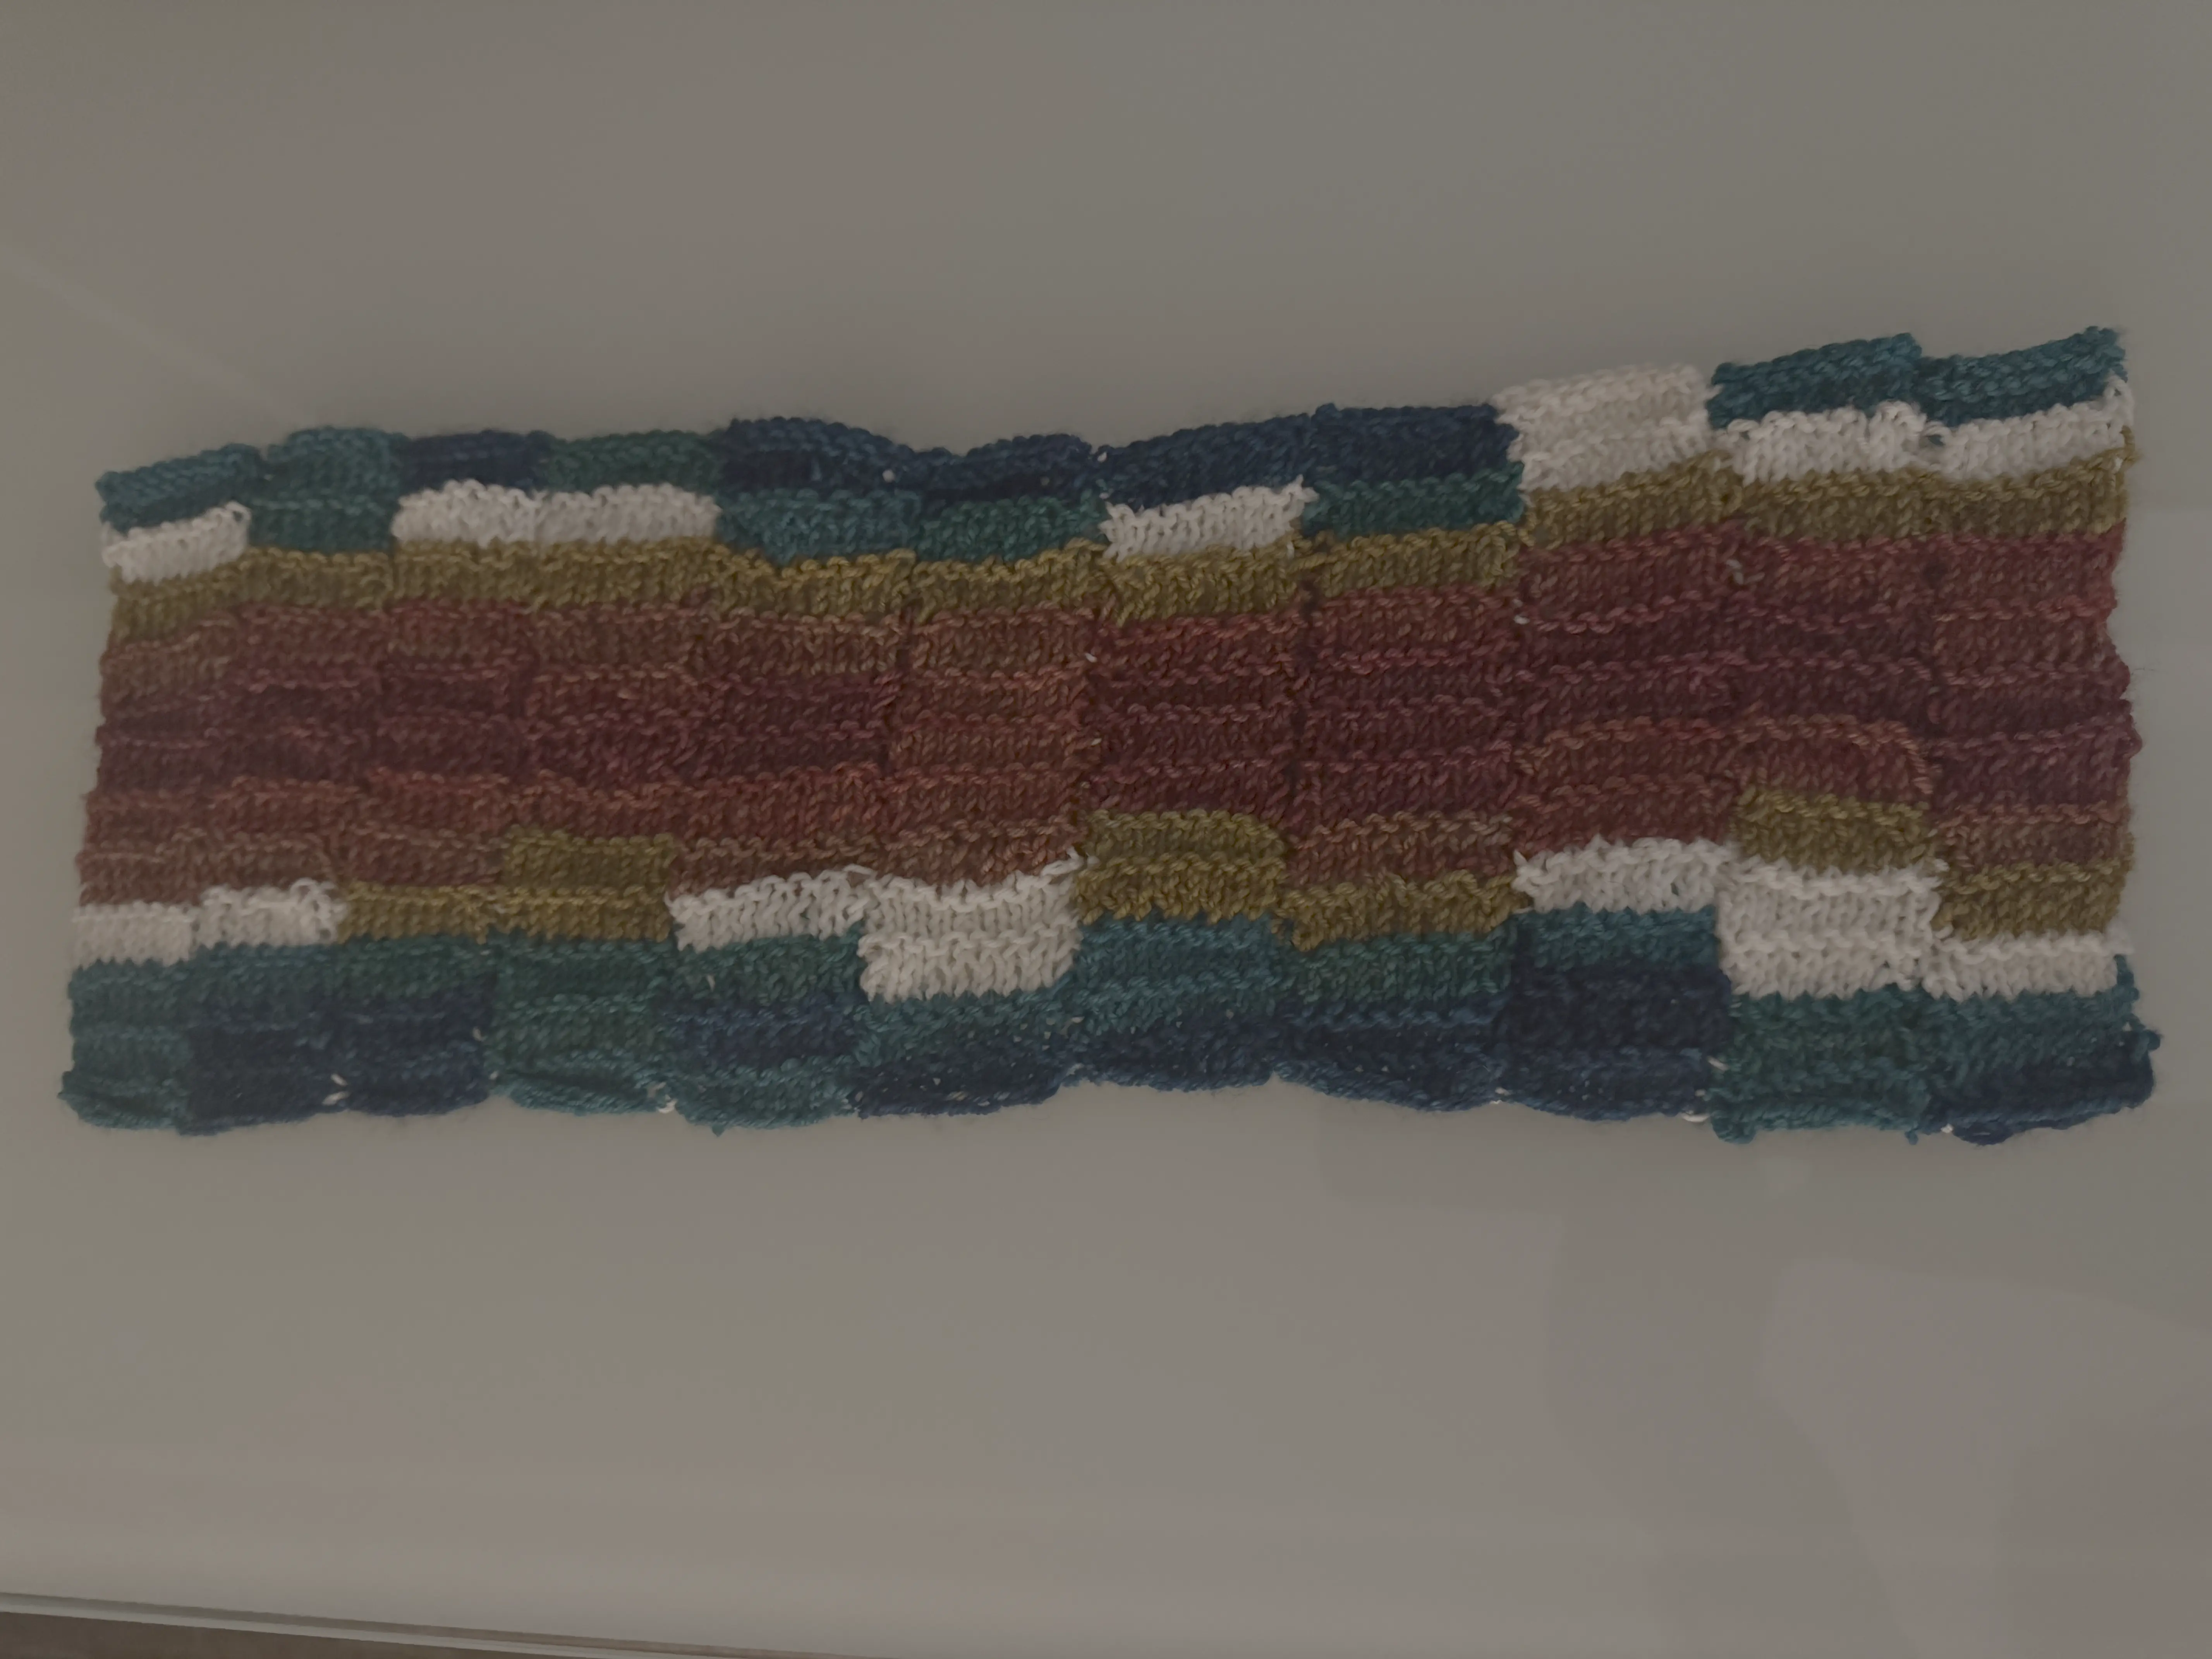
For the talk I made a miniblanket based on average temperature by month in Huntingdon. More details can be found on my ravelry page for the project.
Through the ICERM talk, I met part of the team for the VECINA project and Bianca Thompson made a shiny app for making weather related heat maps from my code. We are planning a comminity art workshop based on the app in the future.
I gave a 5 minute talk, "Make Data Art", as part of the opening sesion at the US Conference on Teaching Statistics in July 2025. Here are the slides.
. The recording of the presentation is here, I am the third five minute talk at about 32:18.Mathemalchemy
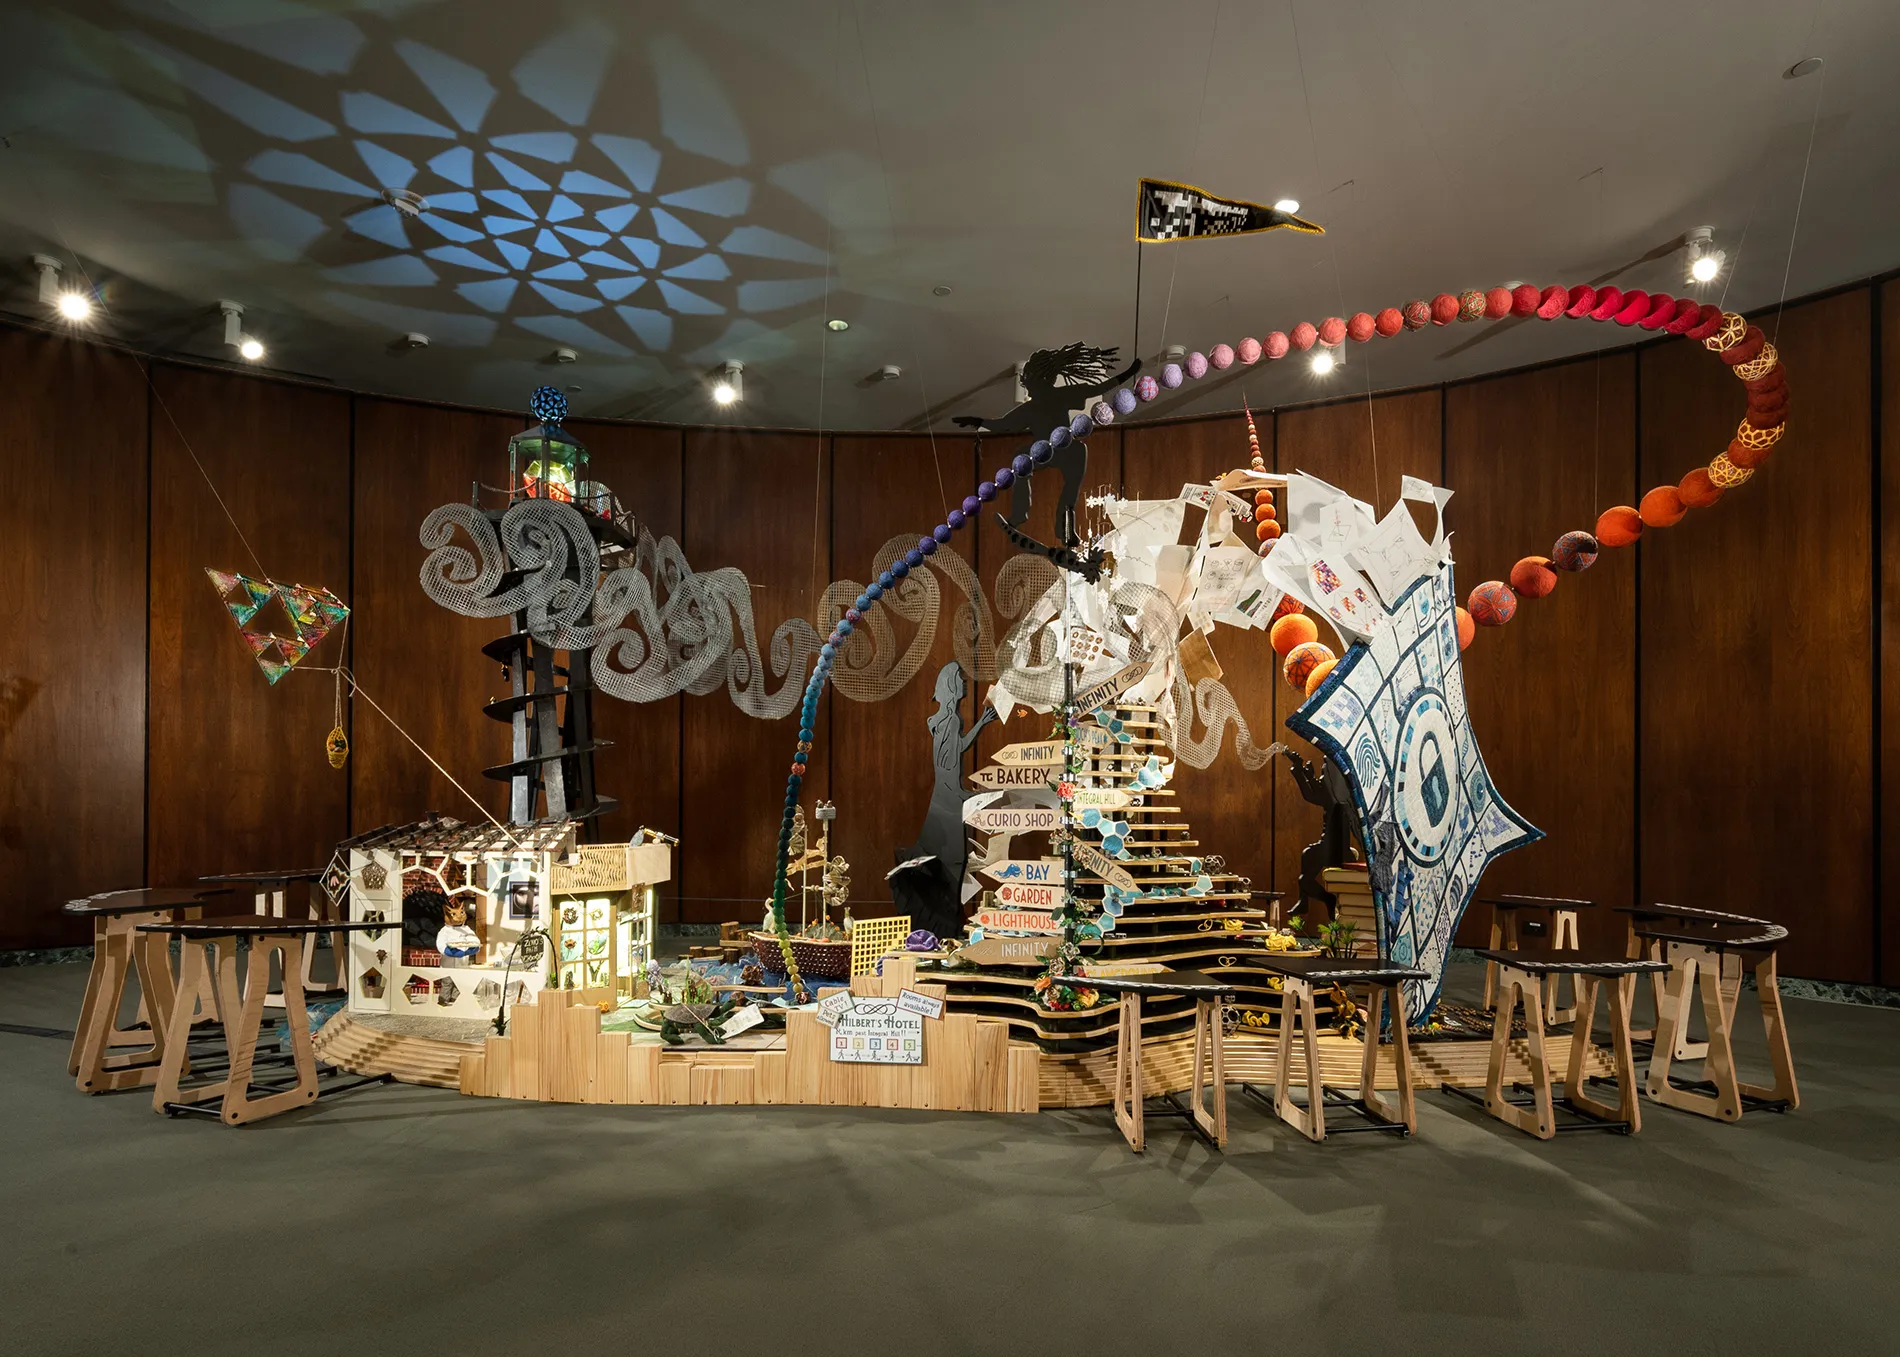
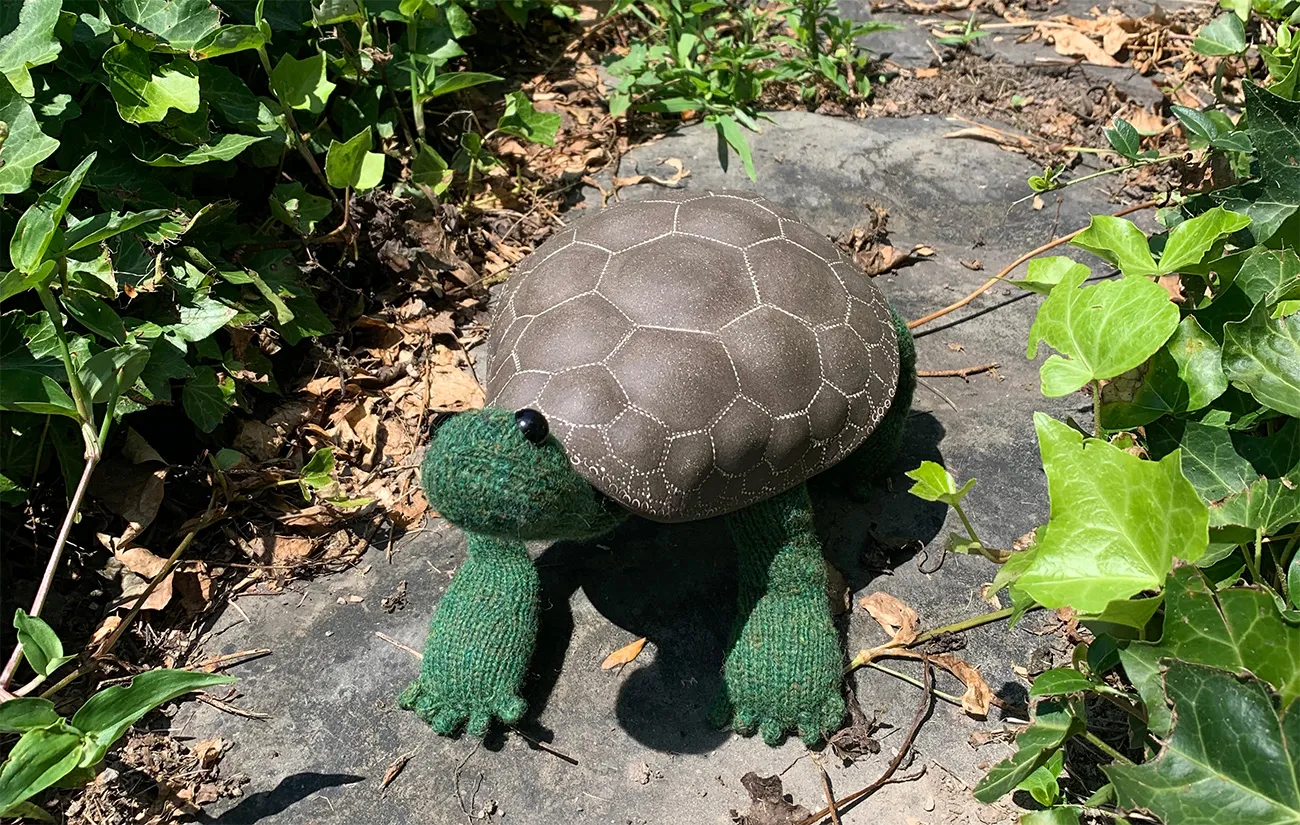
The Mathemalchemy project is a large multimedia art installation that celebrates the creativity and beauty of mathematics, driven by the collaborative energy and enthusiasm of twenty-four mathematical artists and artistic mathematicians. I was one of those mathematical artists!
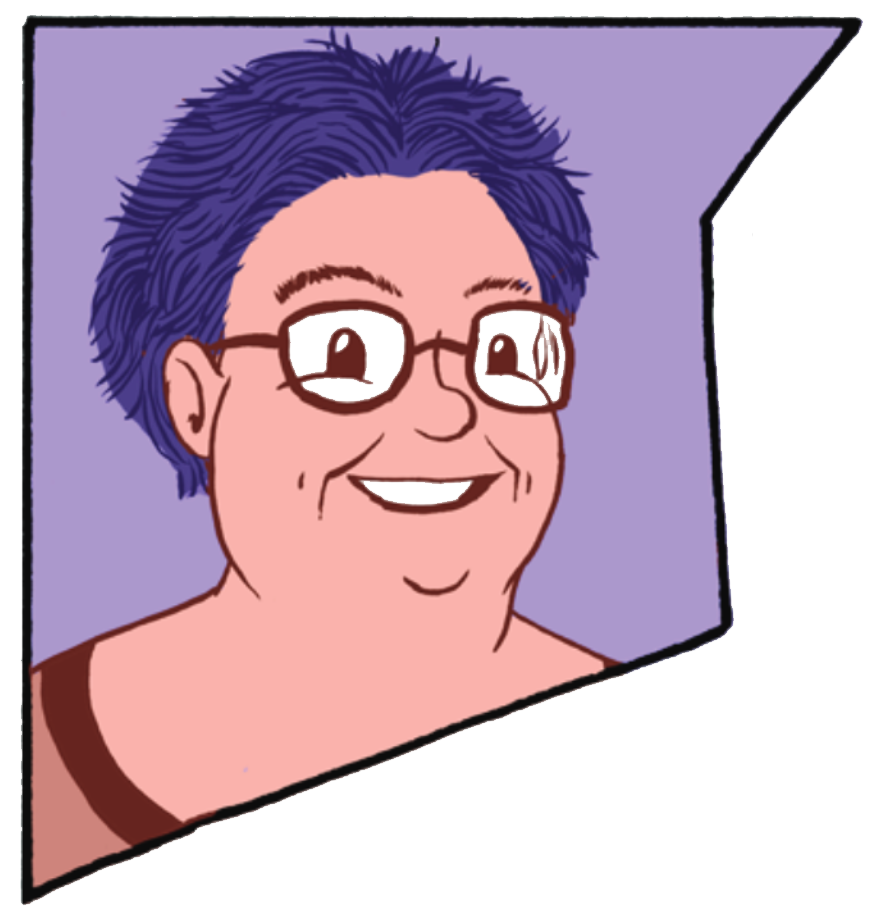
Learn more about the Mathemalchemy project from its website (https://mathemalchemy.org/), which includes related stories, press, and even a comic book adventure in math and art. The comic is by Jay Hosler and Max Hosler and contains the picture of me above that they kindly allow me to use.